Dataset “Big Data for digital monitoring of biodiversity, agriculture and food security – 2020”
Просмотров: 1949
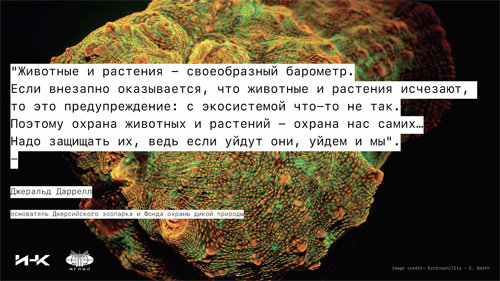
Wildlife is a heritage of humanity which determines conditions for the existence of humankind today and is of high value for succeeding generations. The wealth of the animal and plant world is a special category of sustainable development which encompasses biodiversity, agriculture, and food security. This category is presented in Goal 14 “Conservation of marine ecosystems”, which implies conservation and efficient use of oceans, seas and sea resources, and Goal 15 “Conservation of terrestrial ecosystems”, which implies protection and recovery of terrestrial ecosystems and assistance in their efficient use.
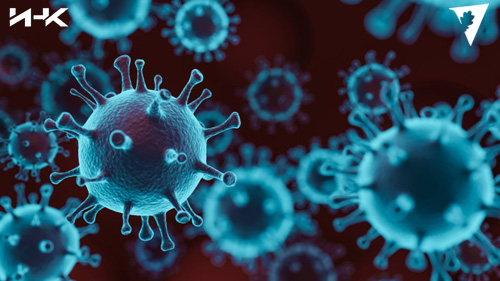
Recent research activities, in particular, the discovery of Indian scientists under the supervision of Rajan Patil, Associate Professor of Epidemiology at the SRM University (Chennai, India), show that biodiversity has a great impact on epidemic proportions and effects. The scientifically proven relation between the decrease in biodiversity and the increased risk of transmission of infection is particularly relevant amid the COVID-19 pandemic, since one of the main hypotheses of emergence of this infection is the mutation of the virus and its transmission from animals to humans. Against the background of recent events and scientific arguments, biodiversity is not only the beauty and wealth of the natural world, but also the basis for the health of humankind.
This category also includes Goal 2 “Liquidation of hunger”, which implies protection and development of food and agricultural sector, offering key solutions for development and being pivotal in the fight against hunger and poverty. According to the UN, about 815 million people across the globe (12.9% of population) are undernourished.
Solving the food security problem is a great challenge, since it requires increasing the productivity of agriculture (against the backdrop of diminished fertility of land due to environmental pollution and climate change in conjunction with reduction of areas under crops due to urbanization), and maintenance of affordability of food, as well as high quality and safety for its human health. This implies a focus on development of agriculture and “green” (ecologically clean) production.
In order to make a consistent presentation of the wealth of the animal and plant world as well as abovementioned logically interdependent goals of sustainable development, the Institute of Scientific Communications (ISC) created its proprietary dataset dealing with the problem of maintenance of biodiversity, agricultural development, and food security. The dataset includes the following indicators (all higher indicator values are better, except those indicators for which there is a contrary provision):
1. Biodiversity based on the data from the UNDP (in 2015-2019):
Conservation of terrestrial ecosystems:
• Imported biodiversity threats (per million population). It represents the number of endangered species due to international trade (import) (a lower indicator value is better);
• Permanent Deforestation (5 year average annual %). It represents the average annual percentage of permanent deforestation. Permanent deforestation is classified as removal of crown cover due to urbanization, commodity production and operation of certain types of small-scale agriculture, excluding the temporary loss of forest due to forestry or forest fires (a lower indicator value is better);
• Red List Index of species survival (0–1) . It represents the change in the overall risk of extinction among groups of species, which is based on real changes in the number of species in each category of endangered species, from Red Data Book;
• Mean area that is protected in freshwater sites important to biodiversity (%) . It represents the average percentage of area of the key fresh-water areas of biodiversity (areas that are important for global conservation of biodiversity), which are protected by the State;
• Mean area that is protected in terrestrial sites important to biodiversity (%) . It represents the average percentage of area of terrestrial (on-shore) areas of biodiversity (areas that are important for global conservation of biodiversity), which are protected by the State;
Conservation of marine ecosystems:
• Fish caught by trawling (%) . It represents the share of total amount of fish (in tons) captured by trawling – this is a fishing method, at which industrial fishing vessels drag large nets (trawls) along the seabed, which poses a major threat to biodiversity (a lower indicator value is better);
• Percentage of fish stocks overexploited or collapsed by EEZ (%) . It represents the share of total amount of fish captured in the country in its exclusive economic zone, which consists of fish that were overexploited or collapsed, weighted by the quality of data on fish capture (a lower indicator value is better);
• Ocean Health Index Goal – Clean Waters (0–100) . It represents water purity, showing the extent to which sea waters within national jurisdiction were contaminated with chemicals and excessive amount of nutrients (eutrophication), pathogenic microorganisms or utility waste (a lower indicator value is better);
• Mean area that is protected in marine sites important to biodiversity (%) . It represents the average percentage of area of key sea (on-shore) areas of biodiversity (areas that are important for global conservation of biodiversity), which are protected by the State.
2. Agriculture based on the data from the World Bank (in 2017-2018):
• Land under cereal production (hectares) . It represents the area that was allocated for cultivation of cereals – total harvested acreage, although some countries report only of areas under crops. Cereals include wheat, rice, maize, barley, oat, rye, panic grass, sorgo, buckwheat and mixed grains. Production data for cereals refer to crops that are harvested for dry grain only. Cereals that are harvested for hay or for food, fodder or silage and those used for cattle grazing are excluded. Data for 2017 are presented;
• Rural population (% of total population) . It represents the difference between the total population and the urban population. Data for 2018 are presented;
• Cereal yield (kg per hectare) . It represents grain harvest measured in kilograms per hectare of harvested acreage, and includes wheat, rice, maize, barley, oat, rye, panic grass, sorgo, buckwheat and mixed grains. Production data for cereals refer to crops that are harvested for dry grain only. Cereals that are harvested for hay or for food, fodder or silage and those used for cattle grazing are excluded. Data for 2017 are presented;
• Agriculture, forestry, and fishery, value added (% of GDP) . It represents forestry, hunting and fishery, as well as cultivation of crops and livestock breeding. Added value is a net product of the sector after the summation of all results and deduction of intermediate incoming materials and raw material. It is calculated without considering deductions for depreciation of finished assets or depletion and degradation of natural resources. Data for 2018 are presented.
3. Food security based on the data from The Economist Intelligence Unit Limited (in 2019):
• Food Security Index (Overall score, Baseline index) . It represents the overall level of national food security with account of international comparisons;
• Food affordability . It represents financial backing of food security programs by the state, access to financing for farmers, as well as living standards of the population and affordability of food;
• Food availability . It represents mean food availability, agricultural infrastructure, and loss of food, which determine affordability of food to great masses of population in quantitative terms (shortage risk);
• Food quality & safety . It represents food standards, accessibility of mineral nutrients (food value, health benefit) and safety of food products, including the possibility of their safe storage.
Advantages of the dataset provided by the ISC:
• Consistency and credibility: collection and systematization of basic statistical data in the common dataset, as well as data analysis with the use of the proprietary methodology for the calculation of the wealth index of the animal and plant world , which makes it possible to carry out digital monitoring of biodiversity, agriculture and food security across the world and make international comparisons;
• Topicality and representativeness: the dataset contains most recent available data (according to the results for 2015-2019), which form the basis for empirical studies in 2020;
• Reliability and objectiveness: the dataset combines statistics of reliable sources of statistical and expert analytical data on the subject from the UNDP, World Bank, and The Economist Intelligence Unit Limited;
• Informativity: the dataset presents up-to-date international statistics in Russian;
• Well-defined structure: in order to make working with the dataset more simple, fast and convenient for users, topic-based sections were distinguished in its structure;
• Availability of patterns: the dataset offers data patterns: integration patterns : G7 countries (developed countries) and BRICS countries (developing countries), CIS countries, EEU countries, geographic patterns of parts of the world, as well as patterns of wealth of the animal and plant world , which enable accelerated selection of necessary data for economical experiments aimed at comparing countries of main categories in real-time mode;
• Data import: the dataset allows selecting necessary information and importing it to Microsoft Excel for the subsequent analysis;
• Interactivity: the dataset allows sorting and combining various data, uniting them in a comprehensive data array in exactly the way that each user needs, and automatically carrying out digital monitoring of biodiversity, agriculture and food security, and visualizing its results for clarity;
• Ranking: the dataset was used as a basis for making the ranking of wealth of the animal and plant world across the world in 2020;
• Operation on a blockchain principle: first, the data as such are logically structured on a blockchain principle; second, the dataset allows sharing information, changing and processing it upon the request of users; the original data remain unchanged at that, which is very convenient and safe.
The data set was developed by Elena G. Popkova, D.Sc. Economics, Professor, President of the Institute of Scientific Communications


