

")
DataSet “Interactive Statistics and Intelligent Analytics of the Balanced State of the Regional Economy of Russia in Terms of Big Data and Blockchain – 2020”
Просмотров: 3981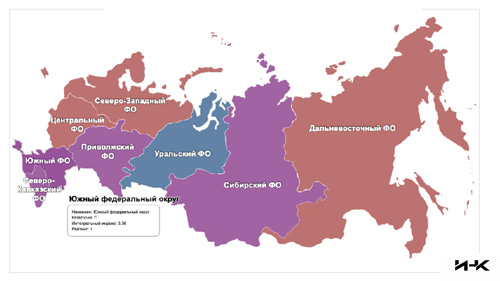
Russia is characterized by the high degree of regionalization, which is due to its geographic, cultural and historical characteristics and causes contradictory consequences. On the one hand, the decentralization of state management supports the multinational nature of Russian society and allows each region to promote, legislate and uphold its unique norms and values. Therein lies the guarantee of social tolerance of Russian population.
On the other hand, differences in the level and the rate of social and economic development of regions are responsible for the lack of balance in the regional economy of Russia, tampering with its integrity. As a result, instability is caused, that is, an increased susceptibility of Russia to various crises: social – in case of escalation of popular discontent in the regions with low standard of life which is manifested in social protests and intensified outgoing migration flows from these regions – and economic – under accelerated rate of inflation in certain regions, a critical fall of living standards of their population and the institutionalization of their subsidized dependence.
In order to achieve the transition of modern Russia from the category of leading developing countries (BRICS) into the category of developed countries (OECD), it is necessary to ensure the balanced state of the regional economy, which found its way into the Strategy of spatial development of the Russian Federation until 2025, ratified by the Decree of the Government of the Russian Federation No. 207-R of February 13, 2019. This means that flexible regulation of the regional economy of Russia is required, which would promote moderate differences in the regulatory framework to maintain cultural identity, tolerance of population of regions and their self-sufficiency (preservation of federalism) and, at the same time, level out differences in the level and the rate of social and economic development of regions (achieving the balanced state).
In this regard, the critical task of economic science is to develop a concept and applied recommendations to fill up the gap in the social and economic situation of regions. However, this is hindered by insufficient and inconsistent statistics of the regional economy of Russia. The main source of official empirical data on the regional economy of Russia is the annual statistical book “Russian regions. Social and economic indicators”.
Although it is available electronically, the indicators that are contained in it are presented in separate sections and are not prepared for automatic processing. The advantage of this statistical book consists in the clearly defined structure and large period of time for which the data are available (2002-2018), and its drawback consists in the difference in values of indicators in the reports for various periods (because the data are recalculated and only the latest reports are updated), and fragmentarity: each report contains data only for the current year and for several random previous periods, which greatly complicates the comparison of data and the study of their dynamics.
Furthermore, there are a number of thematic ratings of Russian regions, the most common of which is the Rating of the social and economic situation of regions – 2019, in which the regions are ranked according to such indicators as the size of the economy, efficiency of the economy, public sector and social sphere. The advantage of this rating consists in the interactivity and the presence of the map of the regional economy of Russia, and its drawbacks are the non-transparency of the methodology (the methodology is presented in general terms only, values of indicators were converted into points) and the static nature of the rating – it is only reflective of the current situation of the region in the economy of Russia, but it is not reflective of the long-term dynamics (all data are presented for 2017-2018 only) and future prospects for its development.
Advanced technologies open up opportunities for extended automated and intelligent data analytics, but these opportunities cannot be implemented in practice due to the lack of special databases of clearly structured digital data integrated into a unified system (interrelated) – data sets. The Institute of Scientific Communications (ISC) contributes to solving this problem and creates the first data set which combines statistics on the topic of the balanced state of the regional economy of Russia, forms Big Data of it, that are logically structured and systematized according to the blockchain principle, and are ready for processing with the use of Artificial Intelligence.
The data set contains indicators, most of which were presented by Rosstat, for the most topical areas of scientific economic studies on the topic of the balanced state of the regional economy of Russia:
• Level of social and economic development:
• GDP per capita and “underdevelopment whirlpools” calculated on the base of it;
• Balanced financial result of enterprises;
• Occupational level;
• Regional budget balance.
• Potential for social and economic development:
• Fixed investment per capita;
• The share of innovatively active organizations;
• The share of innovative products;
• Digitization level ( Digital Russia Index, calculated by the Center for Financial Innovations and Cashless Economy of the Moscow School of Management SKOLKOVO).
Advantages of the ISC data set:
• Consistency and accuracy: collection and systematization of the main statistical data in the common data set, as well as their analysis with the use of a proprietary methodology for the calculation of “underdevelopment whirlpools” , which allows determining both static (for a particular period of time) and dynamic (taking into account changes for a number of periods) balanced state of the regional economy;
• Topicality and representativeness: the data set contains up-to-date information (at year-end 2018), as well as forecasts for 2019-2024, which form the basis for empirical studies in 2020;
• Reliability and objectivity: the data set contains combined statistics from the reliable sources of statistical data, namely the Federal State Statistics Service (Rosstat) and the Center for Financial Innovations and Cashless Economy of the Moscow School of Management SKOLKOVO;
• Clearly defined structure: to make the work with the data set the most simple, fast and convenient for users, thematic sections were distinguished in its structure;
• Presence of templates: the data set offers data templates with two different criteria of classification of Russian regions: geographic (patterns by federal districts) and rating-based (templates by categories), which makes it possible to quickly select the necessary data for economic experiments aimed at comparison of regions in real-time mode;
• Data import: the data set allows selecting necessary information and importing it in Microsoft Excel for subsequent analysis;
• Interactivity: the data set allows sorting and arranging various data, combining them into the common data array in exactly the manner that is necessary to every user, and automatically plotting diagrams ; the data are available on the maps of the regional economy of Russia (by regions and federal districts) and in the form of a rating ;
• Operation according to the blockchain principle: first, the data as such are logically structured according to the blockchain principle; second, the data set allows sharing information, changing and processing it at requests of the users, while the initial data remain unchanged, which is extremely convenient and secure.
Proprietary methodology of the Doctor of Economics, Professor E. Popkova , described and well proven in the following publications (but not limited to them) is used for the calculation of the depth of “underdevelopment whirlpools” in the regions and federal districts of the Russian Federation:
• Popkova, E. (2004a). Spatial-temporal approach in the concept of the new quality of economic growth. Ekonomicheskie Nauki, 7, pp. 33-40.
• Popkova, E. (2004b). The interaction of the concepts of sustainable development and the new quality of economic growth. Finansy i Kredit 25(163), pp. 43-47.
• Popkova, E. (2004c). The interaction of the concepts of sustainable development and the new quality of economic growth. Ekonomicheskiy Analiz: Teoriya i Praktika, 25, p. 43.
• Popkova, E. (2005). Formulation of the concept of the new quality of economic growth in a climate of modern globalization: a doctoral thesis, Penza.
• Shakhovskaya, L., Popkova, E. (2004). New quality of economic growth in a climate of modern globalization. Finansy i Kredit, 23(16), pp. 71-77.
• Popkova, E. (2014). New prospects of economic growth in context of underdevelopment whirlpools phenomena. Applied Econometrics and International Development, 14(1), pp. 5-25.
• Popkova, E. (2017a). Problem analysis of 'underdevelopment whirlpools' as an obstacle for economic growth in Asian countries. International Journal of Business and Globalisation, 19(2), pp. 167-174.
• Popkova, E. (2017b). Use of methodology of “underdevelopment whirlpools” with analysis of problems and perspectives of economic growth in Asian countries . Journal of Entrepreneurship in Emerging Economies , 9(1).
• Popkova, E. , Gornostaeva, Z. , Tregulova, N. (2018). Role of innovations in provision of competitiveness and innovational development of economy and overcoming of “underdevelopment whirlpools” in Russia and countries of Eastern Europe . Journal of Entrepreneurship in Emerging Economies , 10(3), pp. 511-523.
The “underdevelopment whirlpool” be understood as the degree of lagging of the economic system from the reference system in terms of the level of GDP per capita – in this particular case, of a region or federal district from the average level of GDP per capita in the Russian Federation. The “underdevelopment whirlpool” has a static measure – the depth in the specified year – and dynamic indicator – the sucking-in rate of the “underdevelopment whirlpool” for 1 year.
The depth of the “underdevelopment whirlpool” is determined as follows. First, the value of GDP per capita based on current (market) prices for a particular year is taken from the official statistics. Then a year is determined in which the closest value of GDP per capita for the entire Russian Federation (reference value) could be observed. After that, the depth of the “underdevelopment whirlpool” is determined as the difference between the current year and the relevant year. Then the sucking-in rate of the “underdevelopment whirlpool” is determined as the difference between the depth of the “underdevelopment whirlpool” in the current year and its depth in the previous year.
The values of GDP per capita in the Russian Federation are taken as reference values. Since official statistics present data for this indicator only for the period from 1995 till 2016 these data are supplemented for the computational analysis with author's estimation for the period from 1965 till 1994, as well as author's forecast for 2017-2024.
Table 1. Inter-temporal changes in GDP per capita in the Russian Federation in 1965-2024
Year |
GDP per capita in the Russian Federation, rubles |
Year |
GDP per capita in the Russian Federation, rubles |
Year |
GDP per capita in the Russian Federation, rubles |
Year |
GDP per capita in the Russian Federation, rubles |
1965* |
10.6 |
1980* |
304.9 |
1995 |
13,230 |
2010 |
263,829 |
1966* |
13.3 |
1981* |
381.4 |
1996 |
15,212.3 |
2011 |
317,515 |
1967* |
16.6 |
1982* |
477.1 |
1997 |
16,590.8 |
2012 |
348,642 |
1968* |
20.8 |
1983* |
596.7 |
1998 |
28,492.1 |
2013 |
377,006 |
1969* |
26 |
1984* |
746.4 |
1999 |
39,532.3 |
2014 |
405,148 |
1970* |
32.5 |
1985* |
933.6 |
2000 |
49,474.8 |
2015 |
449,098 |
1971* |
40.7 |
1986* |
1167.7 |
2001 |
60,611.4 |
2016 |
472,162 |
1972* |
50.9 |
1987* |
1460.6 |
2002 |
74,884.9 |
2017** |
509,066 |
1973* |
63.7 |
1988* |
1826.9 |
2003 |
97,864.8 |
2018** |
548,855 |
1974* |
79.6 |
1989* |
2285.1 |
2004 |
126,014 |
2019** |
591,754 |
1975* |
99.6 |
1990* |
2858.1 |
2005 |
157,854 |
2020** |
638,005 |
1976* |
124.6 |
1991* |
3575 |
2006 |
196,770 |
2021** |
687,872 |
1977* |
155.8 |
1992* |
4471.6 |
2007 |
241,767 |
2022** |
741,636 |
1978* |
194.9 |
1993* |
5593 |
2008 |
226,008 |
2023** |
799,603 |
1979* |
243.8 |
1994* |
6995.8 |
2009 |
226,008 |
2024** |
862,100 |
*author's estimation;
**author's forecast “all other factors held equal”.
When forecasting all indicators presented in the data set, ISC is guided both by the inter-temporal changes in these indicators over the recent years and by the logic of their changes in the period until 2024 in accordance with the strategic course of social and economic development of the regional economy of Russia. The data set presents the data for the “underdevelopment whirlpools” for 2005-2024 and the data for other indicators for 2016-2024 (figures of digitization level are shown starting from 2017).
The dataset was developed by Elena G. Popkova, D.Sc. Economics, Professor, President of the Institute of Scientific Communications.